本实验中,我们实现了一个基础的 FFT 算法,使用 Python 编写。
Digital Signal Processing @ Fudan University, fall 2021.
实验简介
录⾳,⽤ 8 kHz 采样,朗读单词 signal。
截取 1024 点语⾳信号。
进⾏ FFT 计算,画出幅度谱。
实验报告
0 总览
 1
 2
 3
 4
 5
 6
 7
 8
 9
10
11
12
13
14
15
16
17
18
19
20
21
22
23
24
25
26
27
# main.py
# Parameters
wav_path = 'data/signal.wav'
fig_time_path = 'assets/fft/time_domain.png'
fig_freq_path = 'assets/fft/freq_domain.png'
sample_rate = 8000
n_samples = 1024
def main () -> None :
# Resample to required sample_rate.
y , sr = librosa . load ( wav_path , sr = sample_rate )
# Extract n_samples points.
t0 = np . arange ( n_samples ) / sr
y0 = y [: n_samples ]
plot_time_domain ( fig_time_path , t0 , y0 )
# Compute FFT.
# y0_freqs = nf.fftfreq(n_samples, 1. / sr)
y0_freqs = fft_freq ( n_samples , sr )
# y0_fft = np.abs(nf.fft(y0))
y0_fft = np . abs ( fft ( y0 ))
plot_freq_domain (
fig_freq_path , y0_freqs [ y0_freqs >= 0 ], y0_fft [ y0_freqs >= 0 ],
)
1 重采样
1
2
3
4
# main.py
# Resample to required sample_rate.
y , sr = librosa . load ( wav_path , sr = sample_rate )
首先,我们利用 librosa
为什么不在录音时就直接使用 8000 Hz 采样呢?其实我也想这样做,但即使我使用了专业音频处理软件 Logic Pro,在录音时其支持的最低采样率还是有 44100 Hz,没有更低的选项了。于是只好这样绕了个弯子。
2 截取
由于音频信号可能很长,我们在分析前需要先将信号分割成若干个帧。这里实验没有进一步要求,我们就简单截取了前 1024 个采样。
1
2
3
4
5
6
# main.py
# Extract n_samples points.
t0 = np . arange ( n_samples ) / sr
y0 = y [: n_samples ]
plot_time_domain ( fig_time_path , t0 , y0 )
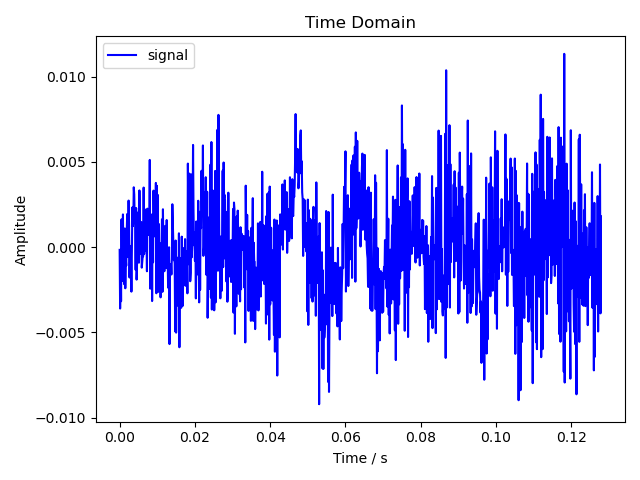
顺便输出一下信号在时域的幅度图。
 1
 2
 3
 4
 5
 6
 7
 8
 9
10
11
12
13
14
15
16
17
18
19
20
# utils.py
def plot_time_domain ( output_path : str , t : np . ndarray , y : np . ndarray ) -> None :
'''
Plot the amplitudes of a wave in time domain.
Args:
`output_path`: path to the output figure
`t`: time of samples
`y`: amplitudes of samples
'''
plt . figure ()
plt . title ( 'Time Domain' )
plt . xlabel ( 'Time / s' )
plt . ylabel ( 'Amplitude' )
plt . plot ( t , y , c = 'blue' , label = 'signal' )
plt . legend ()
plt . tight_layout ()
plt . savefig ( output_path )
时域幅度图
由于截取的是前 1024 个采样,这段音频其实在发 signal 里的 s 音,所以幅度很小,看起来有点像是环境噪音了。
3 FFT
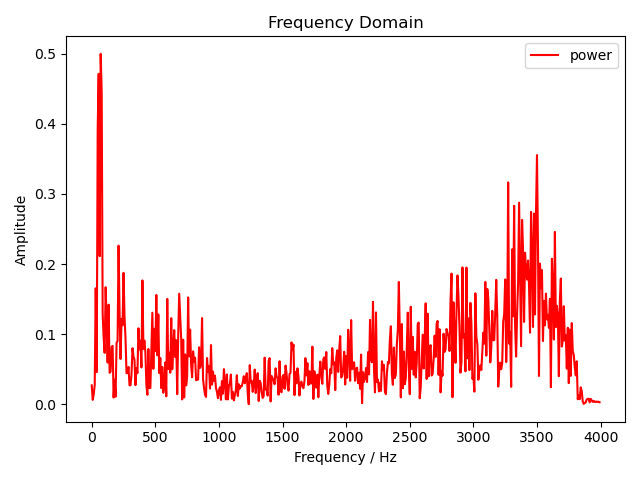
然后我们就对这段信号进行 FFT。这里为了验证我们手写的 FFT 是否正确,我们先使用 numpy 库的 FFT 实现输出一个幅度谱。
 1
 2
 3
 4
 5
 6
 7
 8
 9
10
11
# main.py
import numpy as np
import numpy.fft as nf
# Compute FFT.
y0_freqs = nf . fftfreq ( n_samples , 1. / sr )
y0_fft = np . abs ( nf . fft ( y0 ))
plot_freq_domain (
fig_freq_path , y0_freqs [ y0_freqs >= 0 ], y0_fft [ y0_freqs >= 0 ],
)
频域幅度谱(NumPy)
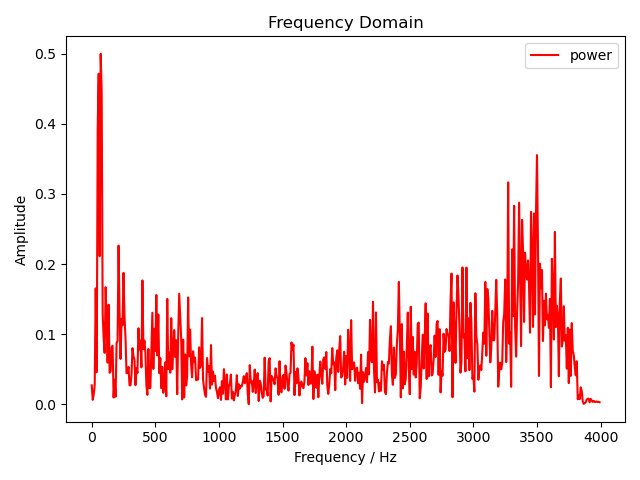
然后将其替换成我们自己的实现。
1
2
3
4
5
6
7
8
# main.py
# Compute FFT.
y0_freqs = fft_freq ( n_samples , sr )
y0_fft = np . abs ( fft ( y0 ))
plot_freq_domain (
fig_freq_path , y0_freqs [ y0_freqs >= 0 ], y0_fft [ y0_freqs >= 0 ],
)
频域幅度谱
可以看到幅度谱一模一样,说明我们的实现是正确的。
4 FFT 实现
本实验中我们实现的是经典的 2 基底 Cooley-Tukey FFT 算法,利用了分治法的思想。算法的输入是信号在时域的幅度数组 $A$,输出是信号在频域的幅度数组 $Y$。
 1
 2
 3
 4
 5
 6
 7
 8
 9
10
11
12
13
14
15
16
17
18
19
20
21
22
23
24
25
26
# fft.py
def fft ( a : np . ndarray ) -> np . ndarray :
'''
Compute the one-dimensional Discrete Fourier Transform.
Args:
`a`: array of `n` complex values, where `n` is a power of 2
Returns:
Array of length `n` containing the result of FFT.
'''
n = a . shape [ 0 ]
if n == 1 :
return a
y_e = fft ( a [:: 2 ]) # even indices of a
y_o = fft ( a [ 1 :: 2 ]) # odd indices of a
y = np . empty ( n , dtype = complex )
w = np . exp ( 2 j * np . pi / n * np . arange ( n // 2 )) # roots of unity
for i in range ( n // 2 ):
y [ i ] = y_e [ i ] + w [ i ] * y_o [ i ]
y [ i + n // 2 ] = y_e [ i ] - w [ i ] * y_o [ i ]
return y
算法的正确性这里就不作证明了,简单说一下这段代码做了哪些事情。
首先,设置递归的退出条件:当输入的数组长度为 $1$ 时,直接返回原数组。
否则,我们将原数组按索引分成两组,奇数一组、偶数一组,然后分别递归执行一次 FFT,得到结果 $Y_o$ 和 $Y_e$。
最后,我们按蝶形架构归并结果 $Y$ 并返回。
$$
\begin{align*}
&Y[i] &= Y_e[i] + \omega_N^i Y_o[i] \\
&Y[i+\frac{n}{2}] &= Y_e[i] - \omega_N^i Y_o[i]
\end{align*}
$$
其中 $N$ 表示数组 $Y$ 的长度(要求 $N$ 是 $2$ 的幂),$\omega_N = \exp(\frac{2\pi j}{n})$ 表示 $1$ 的 $N$ 次单位根。
如此我们就实现了一个基础的 FFT 算法。
当然,返回的 $Y$ 只有幅度数据,我们需要一个辅助函数返回 $Y$ 每个点所对应的频率,也就是其在频域的横坐标。
 1
 2
 3
 4
 5
 6
 7
 8
 9
10
11
12
13
14
15
16
17
18
19
# fft.py
def fft_freq ( n : int , sr : float ) -> np . ndarray :
'''
Return the Discrete Fourier Transform sample frequencies.
Args:
`n`: window length
`sr`: sample rate
Returns:
Array of length `n` containing the sample frequencies.
'''
result = np . concatenate ([
np . arange ( 0 , ( n + 1 ) // 2 , dtype = int ),
np . arange ( - ( n // 2 ), 0 , dtype = int ),
])
return result * sr / n
这里我们就按通常的实现写了,实际上由于我们的输入信号是实数序列,因此并不需要负频率的部分。
5 运行代码
5.1 安装
配置环境前,首先需要安装以下依赖:
然后创建并激活 conda 虚拟环境,同时安装所有依赖包:
1
2
conda env update --name dsp --file environment.yml
conda activate dsp
5.2 使用
将音频文件(WAV 格式)放置于 ./data 目录下,执行以下命令启动程序:
生成的幅度谱将保存在 ./assets/fft 目录下。
5.3 测试
本实验中,我们使用了预录制的音频文件 ./data/signal.wav(未上传至 git 仓库),其内容是单词 signal 的一段朗读语音,按 48000 Hz 采样。
运行程序后,程序将在 ./assets/fft 目录下生成 2 个文件:
time_domain.png:原音频的一个切片(1024 个采样)的幅度图freq_domain.png:信号经 FFT 后在频域的幅度谱
参考资料
Cooley–Tukey FFT algorithm - Wikipedia 


